foundational research • usability testing • conceptual testing • discovery
Rethinking and Redefining Repair Estimates
I had the opportunity to spearhead research efforts for the redesign of RepairPal's Fair Price Estimator experience, from bridging the mental and conceptual understanding of an estimate to evaluating how the redesign performs. Based on the research findings, which informed the design direction and improved user experience, we were able to:
Increase completion by 20%
Improve conversion by 15%
Reduce abandonment by 6%
Timeline
This end-to-end research project took place in Q1 2021, with the product launching the following year in early Q1, 2022.
Team
I was the Lead UX Researcher, closely working with our Lead Designer to identify the research goals and needs. Post-launch, I worked cross-functionally with a Product Manager and a Data Scientist to understand the performance and metrics of the redesigned experience.
Why the Estimator?
One of the universal challenges faced by car owners is price, more specifically the fear of getting “ripped off” or overcharged by mechanics performing car repairs. In fact, in a 2018 study, 54% of Americans feel intimidated when dealing with a car mechanic and only 19 percent of Americans feel very confident they’re paying a fair price when they take their car to one.
RepairPal’s flagship product, the Fair Price Estimator, provides consumers with estimates tailored to their specific vehicles and needs. These estimates are honored at RepairPal's 3,000 certified shops and dealers, so consumers can pay exactly what they're quoted when using the Estimator and have the comfort knowing they’re not getting overcharged.
Identifying the Existing Problems
The current Estimator experience was built with an underlying assumption: consumers know what’s wrong with their cars, and they want to use the Estimator to look up a specific repair. Unfortunately, most users don't know what's wrong with their car. They might hear a strange noise, or the car might feel weird when braking. For 36% of users, that's the extent of their knowledge -- so the Estimator needed to guide users in finding what they're looking for in addition to calculating the estimate.
In addition to the product’s history, there were other identified issues with the product’s experience that translated into poor performance.

Data visual of the conversion & dropoff rates between each step of the previous estimator experience.
High dropoff rates and poor conversion metrics. Our qualitative and quantitative data showed that the interface had poor usability, resulting in increased abandonment rates. An estimated 12% of users couldn’t get past the first step, and an estimated 47% struggled to get through the full experience.
Lack of trust and confidence. Even after receiving their estimate, roughly 35% of users weren’t sure if the number could be trusted.
With that context in mind, I knew I had my work cut out.
Foundational Research
Task Analysis
The Estimator follows a standard 4-step process, ending with a conversion opportunity:
User enters basic details about their car
User selects the repair service
User receives their estimate
User selects a repair shop and books an appointment
Having gotten this context around the product’s legacy and current performance, I started by dissecting the underlying process and structure of the Estimator.

The task analysis above illustrates a central issue about the Estimator: it puts the responsibility on users to know each piece of information in order to progress through the flow. This creates unnecessary friction for the user, in addition to increasing the cognitive load of remembering all various pieces of information.
In addition to highlighting that issue, the Task Analysis also identified task-oriented gaps or challenges within the user flow. We used these as a starting point for the design process, to make sure we captured the general usability improvements in addition to our other goals.
The zip code input was unreliable. Users had to have their browser and system preferences enabled to allow for automatic detection of their location. If users manually input and submitted their zip code too quickly, their zip code would disappear, making it impossible to get past the first step.
Editing vehicle information was a challenge. The Estimator requires users to enter their car’s make, year, and model, in that order. However, if users wanted to edit their year or model, they would have to clear and go back a few steps to reselect, as opposed to performing this action on one screen.
Users were required to know their vehicle’s issue to get an estimate. The Estimator has a list of common repairs for users to choose from, but beyond that, there was no other information architecture by which users could easily search and find repairs. This made the task cognitively overwhelming and led to increased effort for the user. We often saw users relying on Google and other sites to troubleshoot their issue before being able to get an estimate.
It was unclear when the task was “complete.” The Estimator displays the estimate after the user selects a repair service. But it was unclear what the user should be doing next— what they could do with the estimate or that they could have their estimate fulfilled at a RepairPal certified shop.
With these pain points in mind, I wanted to dig further into the entry-points, understanding what triggers a user to even start the Estimator and what their ultimate goals are for completing the Estimator.
Uncovering Motivations

Common pathways users take to get to the estimator
By analyzing RepairPal’s site architecture, we found that users land on the Estimator through a few entry points:
Exploring the RepairPal site and clicking on "Get an Estimate" in the global navigation
Searching terms like “brake pads replacement cost” in Google and finding the Estimator from the results
Landing on the Estimator page from a Google search
Finding the Estimator through a link on another RepairPal page
Returning to the Estimator after using it in the past

A few methods users engage with for additional help and troubleshooting
As noted in the task analysis, the Estimator currently requires users to have knowledge about their vehicle and its issues. However, we found that many of our users need additional help in getting an estimate. Users commonly practice the following:
Searching Google for a specific car repair service, along with their vehicle information (i.e. “ford f-150 head gasket replacement”)
Reading troubleshooting articles on RepairPal’s site
Referring to their car manual or vehicle registration
Physically going to their car to examine it for vehicle information, vehicle additions (such as measuring tire size), service signals (warning light on the dashboard)
Conceptual Understanding

As the final step in our discovery process, I wanted to understand how users perceive the concept of a repair estimate.
While improving the user experience and interface would help with our near-term business goals around conversion and completion rates, understanding our users’ personal significance behind their estimate would help with our long-term product development goals. We would be able to (1) better understand what users are looking for when they arrive at the Estimator, and (2) provide them with that value.
To start, I conducted a survey with over 360 users. I asked them a few basic questions that we could then synthesize to draw bigger conclusions about the Estimator’s future. From this, we were able to form a clear picture of what an estimate meant for our users, and what information they wanted to see included with it.
-
Users define an estimate as a preliminary, approximate price range. Users commonly associate estimates with big purchases or services, including purchasing and repairing vehicles.
-
Estimates are expected to include an itemized breakdown. Users get price estimates if they want to compare multiple services or if the expense is substantially large. This is because users want to gain a non-committal understanding prior to actually making the purchase or repair. Additionally, users are more inclined to get a price estimate if the process is easy. However, even users who didn't have a good experience with the Estimator claimed that they would use it again out of necessity.
-
Users want to feel that they can rely on the repair estimate provided by the Estimator. Users consider reliability across four criteria:
Consistency: users want to see that the estimate is consistent and accurate with their other research
Transparency: users want to know how the estimate is calculated
Brand Trust: users want to feel that their estimate comes from a trustworthy and expert source
Confirmation: users want to receive “written” documentation of their estimate, like an estimate number and email copy for reference
-
Users tend to follow a consistent practice for getting a repair estimate.
Search for possible issues with the vehicle based on symptoms or any signals from the vehicle's dashboard.
Get an idea for potential price by looking online for the market value per service.
Ask for recommendations for shops to fix their vehicle. Call a few shops to check with pricing based on prior research and to ensure that they service their vehicle.
Choose a shop (based on reviews, trust from recommendations, and pricing) to schedule an appointment for the repair.
Design Handoff
The breadth of findings from this foundational phase of research were extensive, so it was important for me to highlight some key takeaways.
I shared these takeaways with our Lead Designer Nicole Garcia to provide her with a direction when redesigning the experience.
Users consider repair estimates extremely important in their repair process. Having an estimate unlocks a user’s ability to compare and evaluate prices, and it reinforces trust and reliability with the user.
Users tend to have frustrations over not being able to find what they were looking for in the Estimator, from their vehicle to specific repairs.
The interface was confusing, difficult to navigate, and cognitively overwhelming. Users found it challenging to complete their tasks and often abandoned early-on in the process.
Evaluative Research
Following the extensive research process, our Lead Designer began her design process. Within the first few iterations, it became apparent that the design direction took a significant departure than what the current experience consisted of. To ensure that the new approach maintained the same functionality while being more intuitive and valuable, I created a research plan to conduct evaluative testing on the usability and effectiveness of the new designs.
What did we want to test?
Before setting up my research plan, I brainstormed a list of design-specific questions with our designer. This was a critical step in my process, as I wanted to ensure we addressed all the aspects of the new design approach when testing and identify areas where we could potentially make improvements.
Improve the intuitiveness of the Estimator
Can users easily find what they’re looking for? Are repair services more discoverable in the new design?
Do the groupings and services breakdown match users’ expectations and allow for simple navigability?
What do users think of the focused experience?
Build a useful and valuable product
Are users able to get their desired repair estimate?
Do users want to come back and use this product again?
How were we measuring success?
With the desired design questions identified, the next step in my research plan was tying the expected behavioral observations with our business objectives.
When socializing research, emphasizing how the research findings will tie with our business objectives drives impact. This also makes receiving research buy-in a much simpler process.
We can also start measuring success as early as pre-development through launch! These same metrics will be measured once the Estimator launches, so we’ll be able to see the evolution of the Estimator’s performance.
Increased engagement with the Estimator
Users are able to progress further into the Estimator journey, getting through more steps without getting stuck.
Increased completion & conversion rates
More users complete the Estimator and book an appointment with a shop for the specified repair estimate.
What tasks did our users complete?
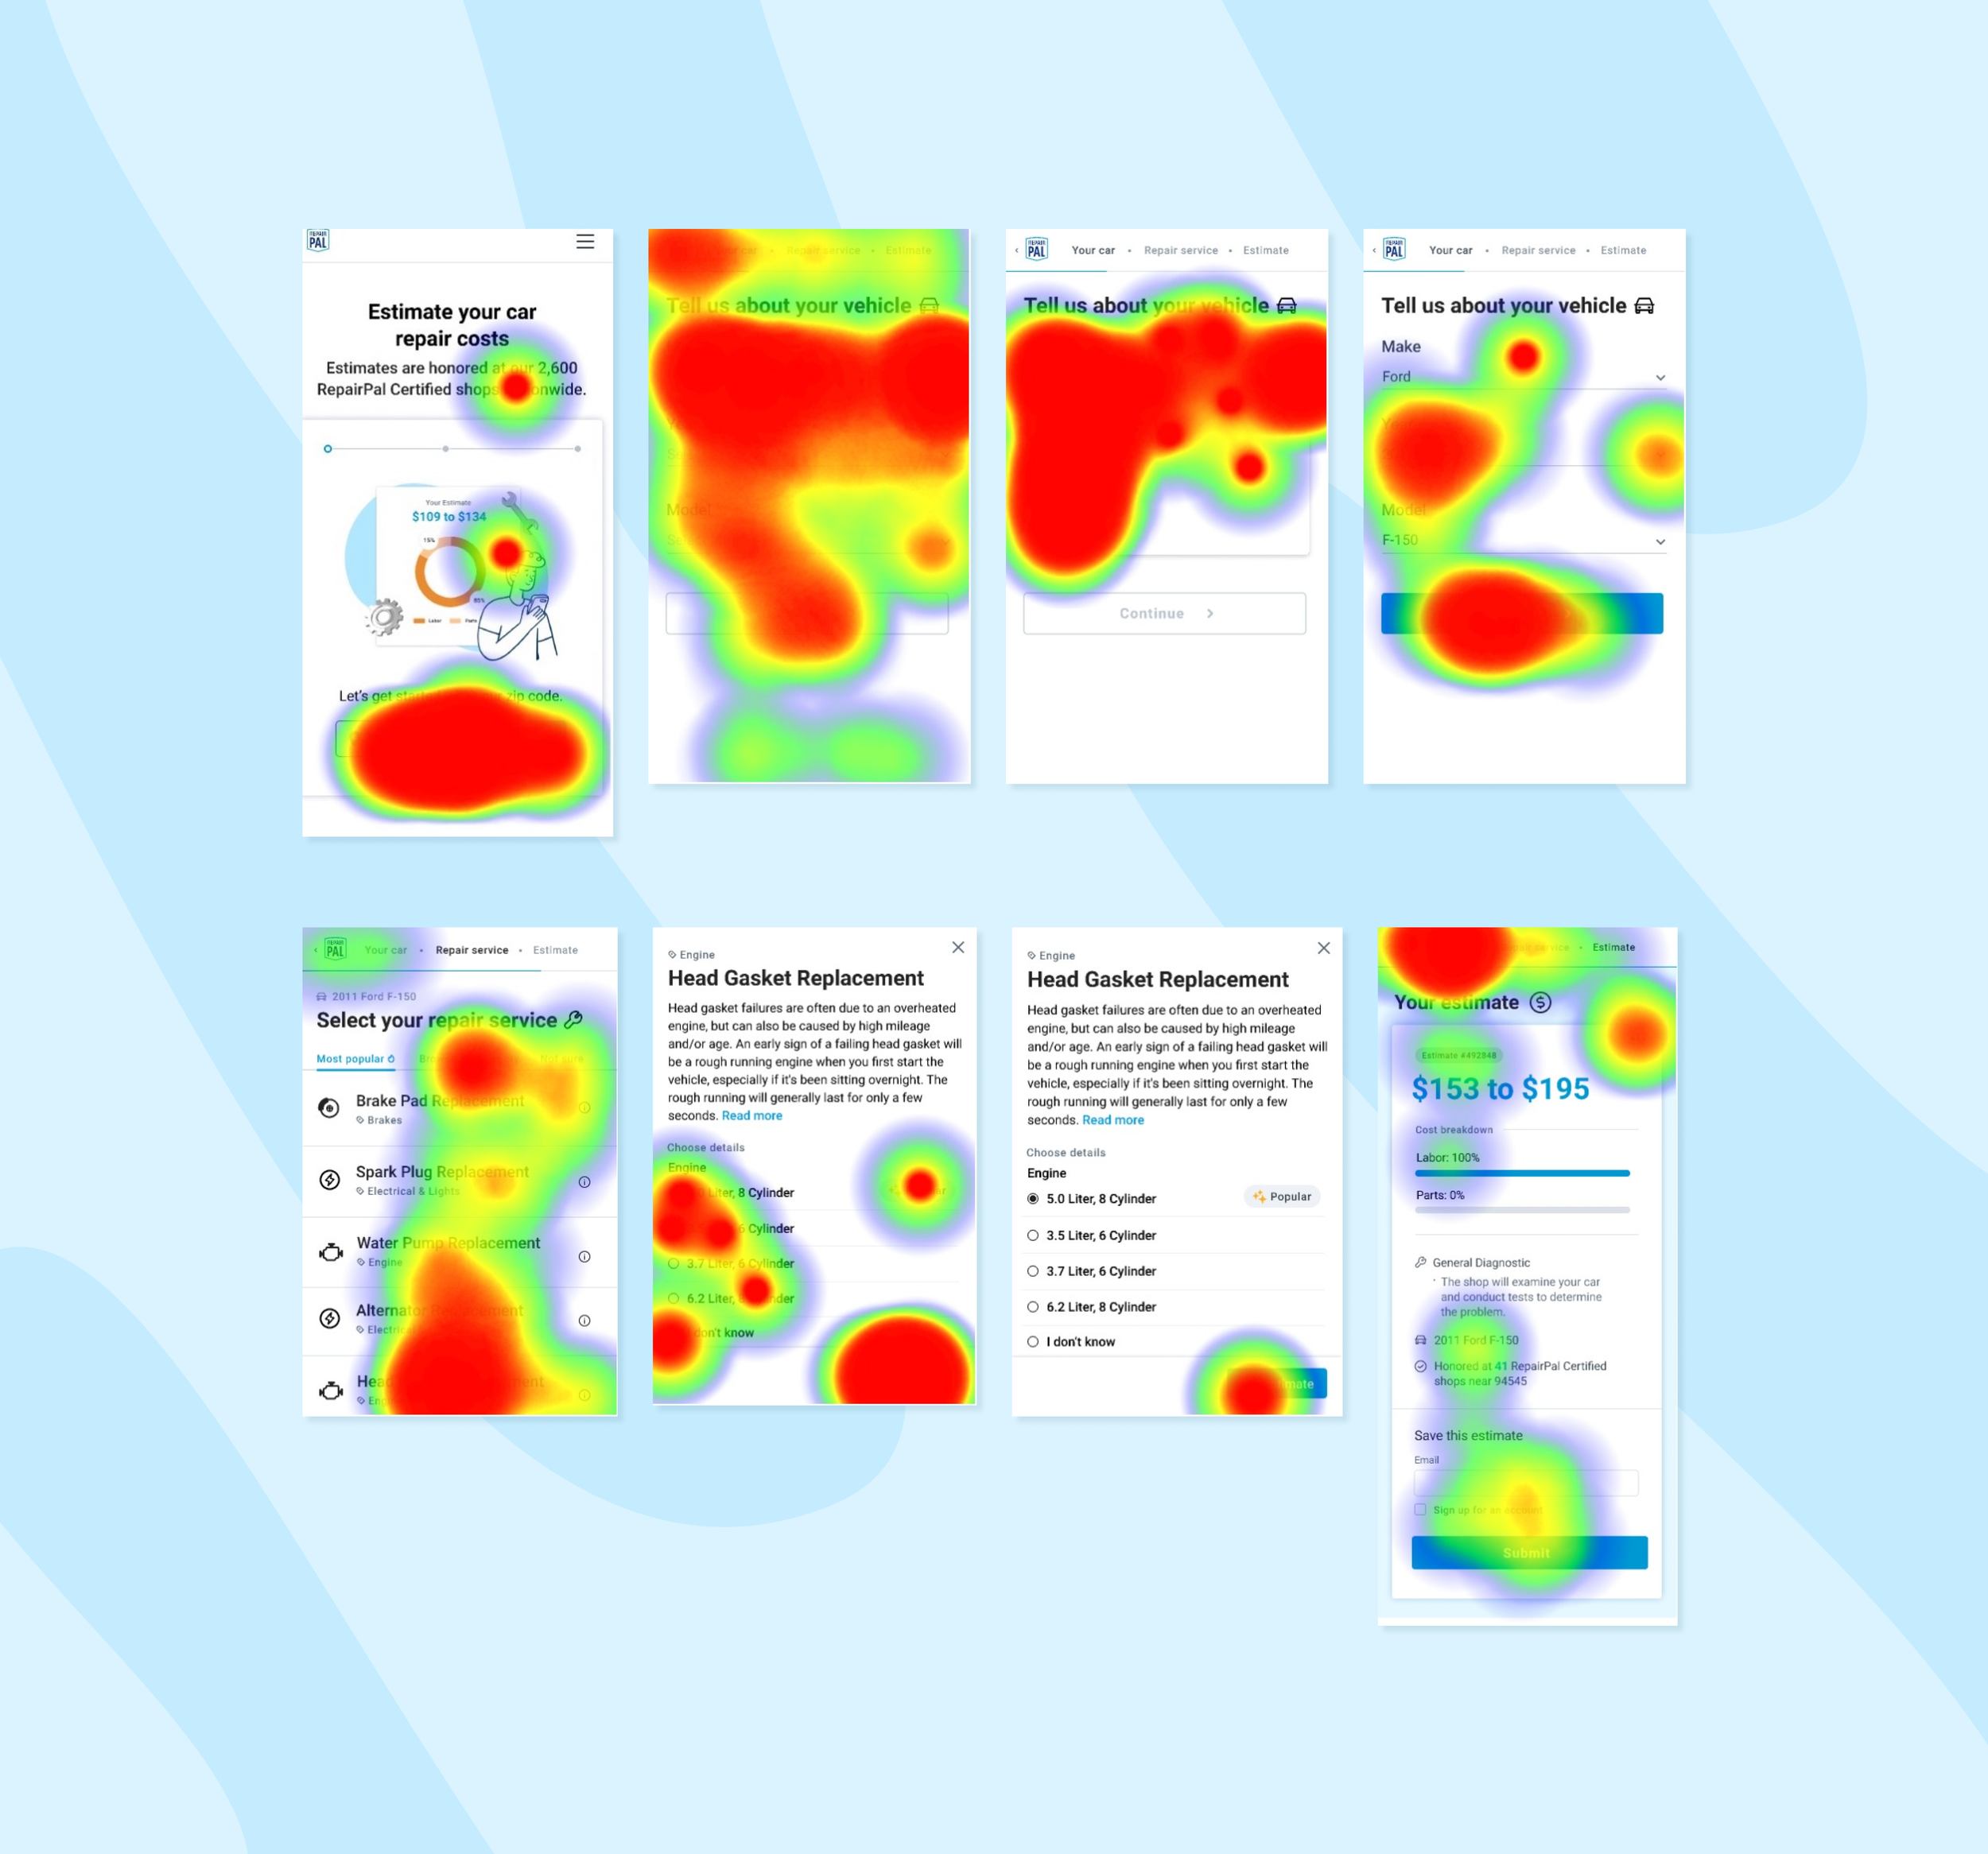

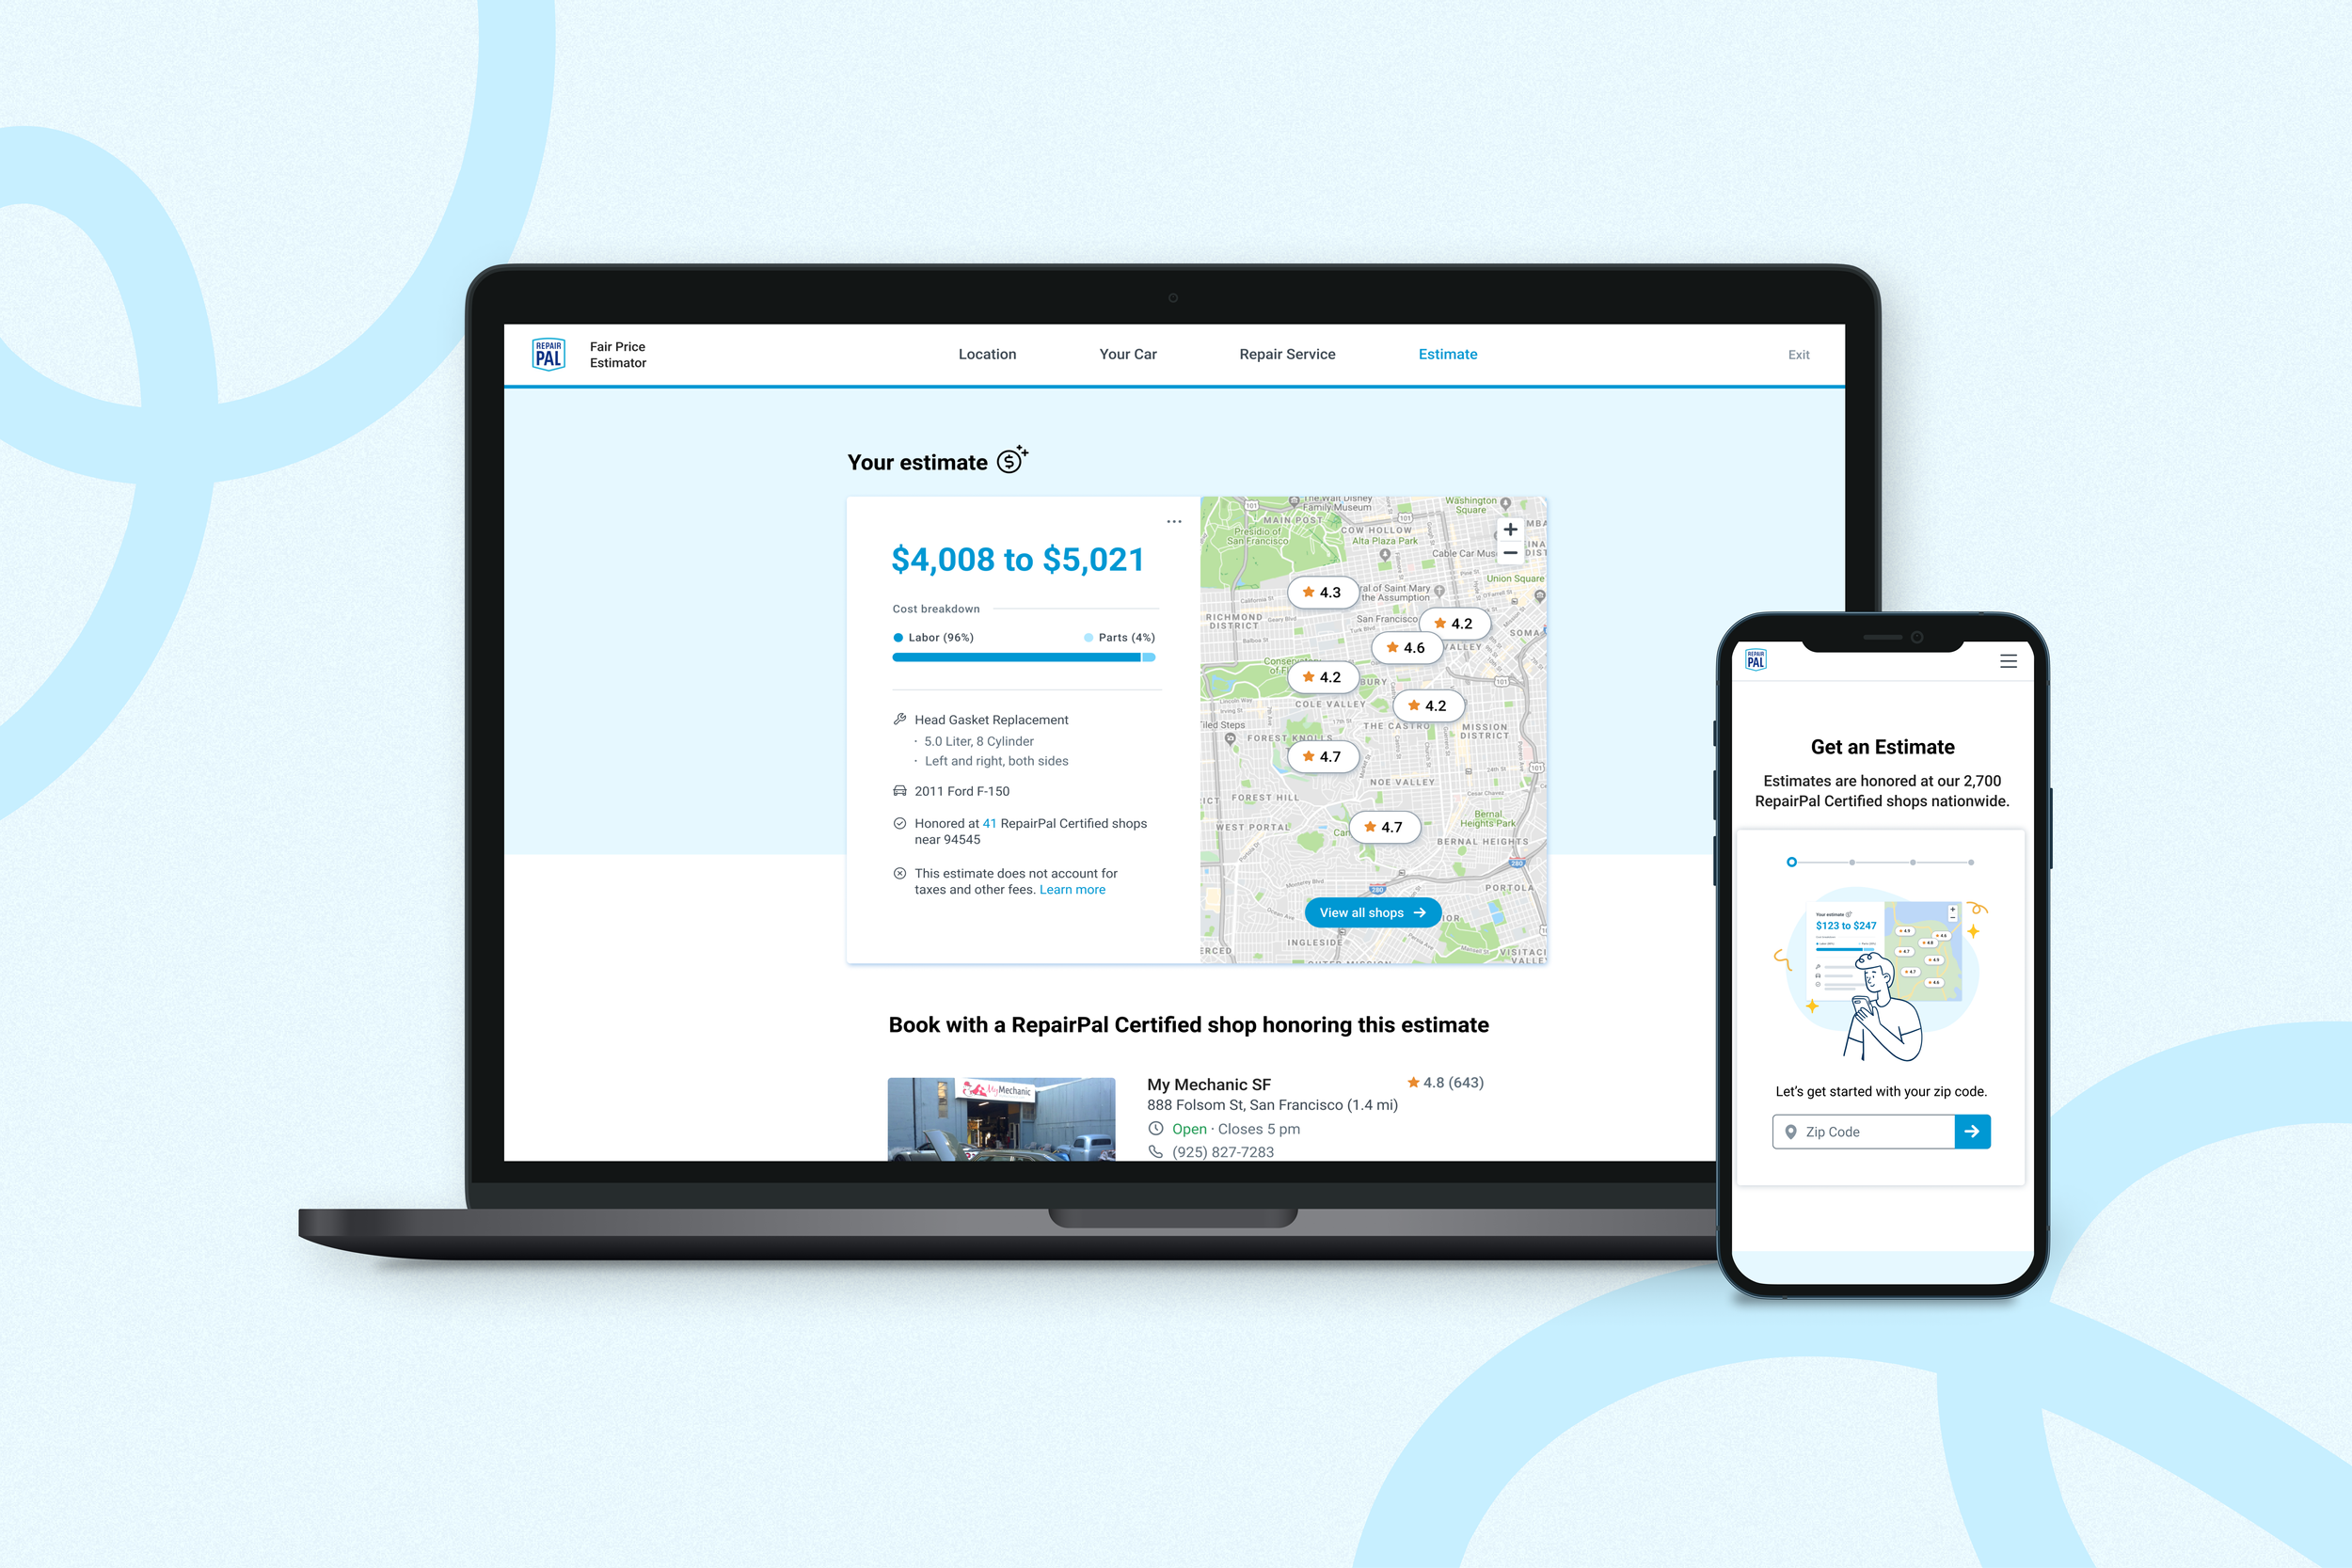
Left: Prototype users engaged with for usability testing; Right: Heatmaps from the usability sessions
To get a feel that the Estimator’s functionality, intuitiveness, and ease-of-use is matched, users would be completing the following 4 tasks.
Get an estimate for a Head Gasket Replacement for your 2011 Ford F-150.
Choose the most popular engine size.
You aren’t sure if the Head Gasket Replacement is actually the repair you need. Edit your repair service to be a General Diagnostic.
You’re satisfied with this estimate and want to get another one for your 2011 Ford Explorer. Edit your vehicle’s information.
These tasks were topical, covering major points of the new proposed design and experience to ensure that it was successful with users (or to identify any issues). To test these tasks with users, I created an interactive prototype based on the designs.
What were the outcomes of usability testing?
A total of 25 users completed the unmoderated usability testing sessions. Users had an average success rate of 90%, with all users completing each of the expected tasks. Additionally, users were able to complete each of the tasks in under 30 seconds, indicating that it was clear enough what was required of them and how to accomplish that task.
More than 80% of our users mentioned that they were satisfied with the estimate and would trust it going into a repair shop. The new design, with the improved information architecture, also gave users more confidence in being able to find their repair.

Design Recommendations
Of the successes, there were a few areas we identified for improvements based on the user feedback.
After sharing these with our Lead Designer, we were ready to move forward with the final designs and development.
Prominence of Navigation - While it was simple for users to go from one step to the next, the navigation at the top was subdued in design and therefore hard to notice. This made it a bit difficult for users to go back in the flow and make edits to their information.
Search Option - While the new information architecture met our users’ expectations, users mentioned needing a search ability. We found this to be an important interaction that was currently missing in the design.
Launch!


After many months of research, design, and development by our cross-functional teams, the redesigned Fair Price Estimator launched in January 2022. To observe the changes in performance and measure the success of the design changes, we first shipped the Estimator as an A/B test.
Diving into the Data

Comparison between the performance of the previous vs. newly-launched estimator
When comparing the old Estimator experience to the redesigned experience, the new Estimator had a 15% increased completion rate across all the steps in the process.
More notably, between starting the Estimator to getting past the first step, the abandonment rate decreased by 5%. There was significantly less drop-off in between each step, which can be attributed to the new design being much more minimalistic, focused, and most importantly mobile-first.
Additional Opportunities
While this new Estimator experience was clearly successful and addressed a lot of users’ pain points identified in the research, we’ve since identified a few areas of improvement.
Determining the appropriate conversion funnel. Even though more users were completing the flow and receiving estimates, we weren’t seeing much increase in conversion. This begs the question - Do users even want to find shops to book with after receiving their estimate? Understanding our users’ intent post-estimate will help answer this, and it opens up an opportunity for some collaborative discovery.
Getting multiple estimates at once. With vehicle repair, there are often multiple services bundled together. Allowing users to add on suggested repairs that are commonly done together can help with improving the accuracy of the estimates prior to getting the vehicle serviced at a repair shop.
What was it like working on such an extensive research project?
Being a part of the redesign efforts for the Estimator was a rewarding, humbling, and empowering experience. This was the first project that was rooted in research, having it be front-and-center for the design changes that were being made. The multi-phased approach, starting with the foundational research efforts to the evaluative testing, pushed my skills as a researcher and indicated the value and breadth that user research can bring. Seeing the impact research brought to the Estimator redesign project opened opportunities for me to scale Research at RepairPal and continue to work on high-impact projects moving forward.
A massive thanks to Chandler Gassman for her phenomenal graphics to visually aid my stories.